

Engineering-grade spatial data and visual condition assessments captured at 40 km/h.
Exceed your IPWEA reporting requirements with a measurable digital twin of your entire road network.
Road Network Intelligence & Mobile Mapping
ISO 9001
-
ISO 14001
-
ISO 45001
-
Bridge Inspection Level 1
-
CASA Certified ReOC
-
$20m Insurance
-
ISO 9001 - ISO 14001 - ISO 45001 - Bridge Inspection Level 1 - CASA Certified ReOC - $20m Insurance -
The Challenge
Your road data is outdated, incomplete, or unmeasurable.
Local governments and infrastructure managers face immense pressure to maintain accurate, IPWEA-compliant asset registers across thousands of kilometres of sealed and unsealed roads. Traditional manual inspections are slow, subjective, and expose personnel to live traffic risks. While basic vehicle-mounted cameras provide a visual record, they fail to deliver the measurable spatial data required for accurate engineering assessments, volume calculations, and long-term financial planning. Relying on 2D images alone leaves critical gaps in your 10-year asset management plan.Pain Points (Why You Are Here)
Compliance Pressure:
You need to complete your 5-yearly road network assessment to meet IPWEA Practice Note 9 and 12.1 guidelines, but your current data is outdated or incomplete.Subjective Condition Ratings:
Manual visual inspections result in inconsistent condition grading, making it impossible to accurately prioritise capital expenditure.Unsealed Network Blind Spots:
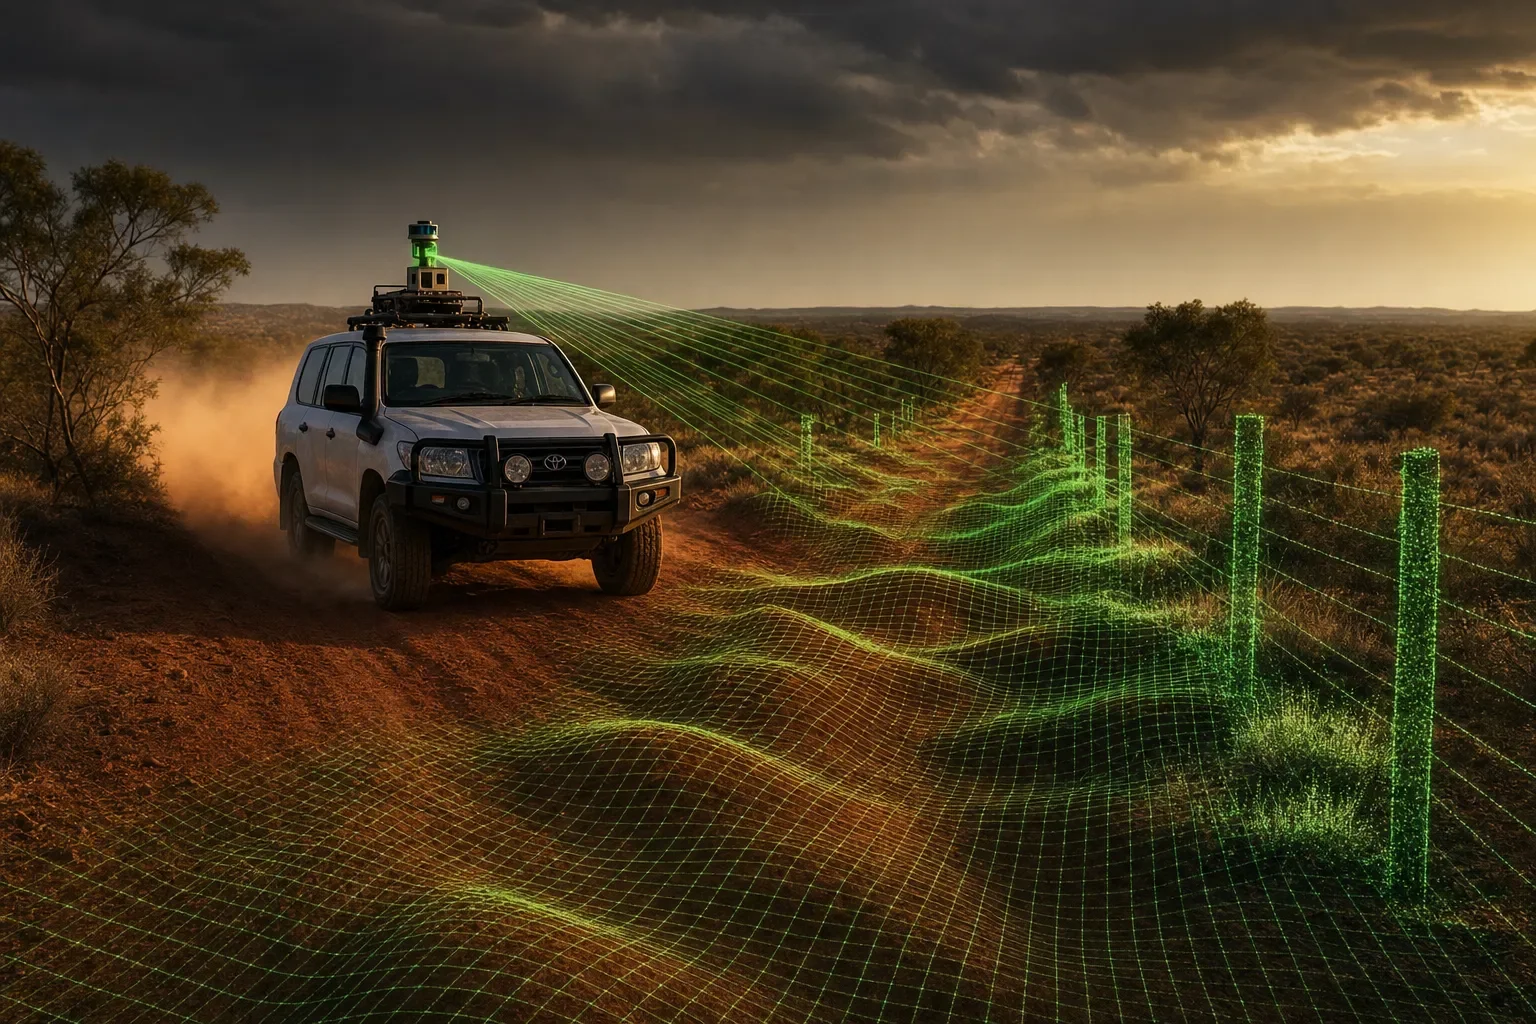
Many providers only scan sealed highways, leaving your extensive unsealed rural road network and fire trails undocumented and unmanaged.The "Photo-Only" Limitation:
You have thousands of street-level photos, but when you need to measure the depth of a rut, the clearance of a bridge, or the volume of a pothole, the data is useless.The Solution: One Pass. Two Datasets.
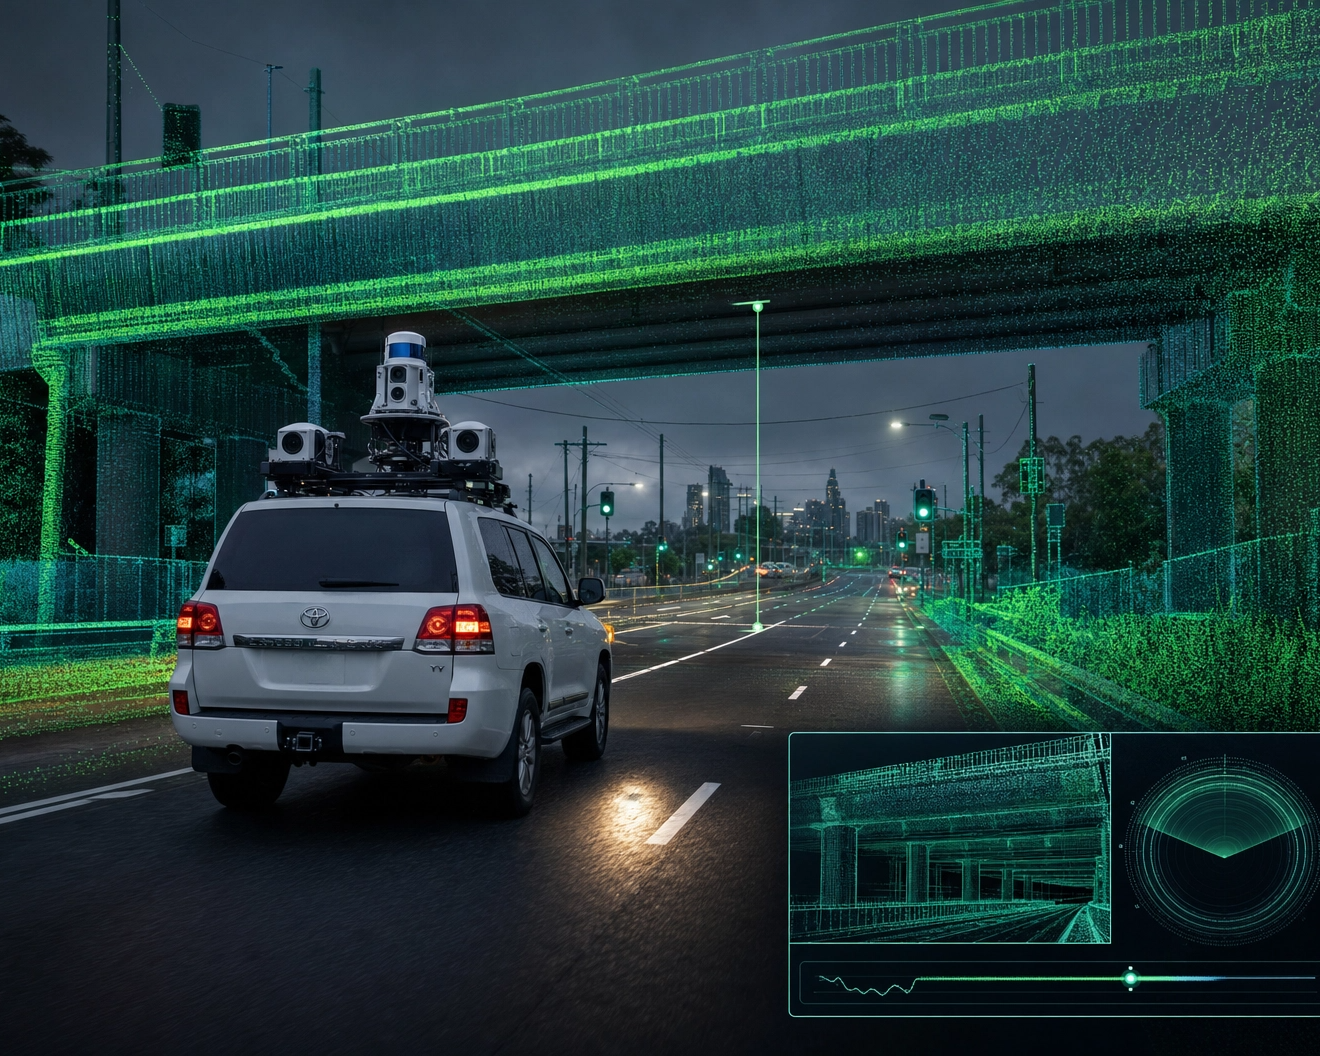
Measurable Reality Capture
Pavement Condition Index (PCI) & Automated Grading
We do not just photograph your roads; we measure them. DeepSky IQ deploys vehicle-mounted LiDAR systems with an embedded 360-degree camera system to capture your entire road network with accurate capture at up to 40 km/h. We deliver both high-resolution visual records and a measurable 3D point cloud in a single pass.This allows your engineering teams to not only identify surface defects but also precisely measure rutting depth, culvert dimensions, and vegetation clearance zones from their desks.Every road segment is graded to the IPWEA 1-5 condition scale using AI-assisted classification calibrated to Practice Note 9 standards. Pavement Condition Index scoring is automated, repeatable, and audit-ready for direct integration into your 10-year asset management plan and capital works prioritisation.
640,000
Points per second2 cm
Relative Accuracy3 cm
Absolute Accuracy40 Km/h
Capture Speed100m
RTK dropout toleranceWhat Sets Us Apart
We don't just photograph your roads. We measure them.
Road Asset Management
Engineering-grade intelligence.
Most providers in the road assessment market offer 2D image capture combined with AI defect detection. They provide a visual record. DeepSky IQ provides a measurable spatial reality. By combining 360-degree imagery with survey-grade LiDAR in a single vehicle-mounted pass, we eliminate the need for secondary survey teams when precise measurements are required for capital works planning. We integrate aerial data from drones and underwater data from ROVs to acquire intelligence on submerged assets. IPWEA-Aligned Deliverables
Data is processed and formatted to align with IPWEA condition grading models (1-5 scale), ready for direct ingestion into your existing asset management software (e.g., Assetic, Conquest).Survey-Grade Mobile LiDAR
Capture up to 640,000 points per second with a relative accuracy of 2 cm. Our systems maintain precision even during RTK signal dropouts of up to 100 metres, delivering engineering-grade spatial data for complex urban corridors and dense tree canopies.360-Degree Visual Assessment
Dual 48MP panoramic cameras capture continuous, high-resolution street-level imagery. This provides the visual context required for AI defect detection, signage inventory, and community engagement, fully synchronised with the 3D point cloud.Sealed and Unsealed Network Coverage
Our ruggedised 4WD survey vehicles and 4WD trained staff are equipped to handle both sealed highways and remote unsealed rural roads, ensuring your entire asset register is updated, regardless of terrain.Multi-Modal Integration
Where vehicles cannot go, our enterprise drone fleet and ROVs take over. We integrate aerial LiDAR and photogrammetry for roads, bridge undersides, major culverts, and off-road drainage networks, and our ROVs capture submerged defects and conditions, delivering a complete digital twin of the infrastructure.References
[1] Institute of Public Works Engineering Australasia (IPWEA). "Practice Note 9: Visual Assessment of Flexible Pavements."
[2] Institute of Public Works Engineering Australasia (IPWEA ). "Practice Note 12.1: Climate change impacts on the useful life of infrastructure."
| Capability | DeepSky IQ | Typical | Value Impact |
|---|---|---|---|
| 360-degree road imagery | ✓ | ✓ | 100% network visual record |
| Survey-grade LiDAR (640K pts/sec) | ✓ | ✗ | Measurable data vs subjective photos |
| Measurable 3D road model (2cm accuracy) | ✓ | ✗ | Eliminates re-visits for measurements |
| Cross-section profiles every 10m | ✓ | ✗ | Drainage and camber issues identified |
| Pothole and rutting depth measurement | ✓ | ✗ | Objective severity scoring, not opinion |
| Unsealed road capability (4WD mounted) | ✓ | ✗ | Full network, not sealed-only subset |
| Vegetation clearance envelope mapping | ✓ | ✗ | Proactive hazard identification |
| IPWEA Practice Note 9 alignment | ✓ | ✓ | Audit-ready compliance |
| Capability | DeepSky IQ | Typical | Value Impact |
|---|---|---|---|
| Level 1 bridge inspection (visual + drone) | ✓ | ✓ | Zero personnel under live traffic |
| Underside inspection without EWP or lane closure | ✓ | ✗ | No road closures, no traffic management |
| Crack width measurement (0.1mm resolution) | ✓ | ✗ | Objective defect quantification |
| 3D structural model of each bridge | ✓ | ✗ | Remote re-inspection from office |
| Thermal anomaly detection (delamination) | ✓ | ✗ | Hidden defects found before failure |
| Condition scoring per structural element | ✓ | ✓ | Prioritised maintenance scheduling |
| Change detection vs previous inspection | ✓ | ✗ | Deterioration rate tracked over time |
| Capability | DeepSky IQ | Typical | Value Impact |
|---|---|---|---|
| Survey-grade 3D point cloud (interior + exterior) | ✓ | ✓ | Complete spatial record of asset |
| BIM-ready export (IFC, RVT, DWG) | ✓ | ✗ | Direct integration with design software |
| Design vs as-built overlay comparison | ✓ | ✗ | Construction defects identified instantly |
| Interactive virtual walkthrough (shareable link) | ✓ | ✗ | No site visit needed for stakeholders |
| On-model measurement tool (any dimension) | ✓ | ✗ | Measure anything, anytime, from office |
| As-built floor plans (CAD-ready) | ✓ | ✓ | Renovation planning without manual survey |
| Change detection between scans (temporal) | ✓ | ✗ | Movement and settlement tracked to mm |
| Clash detection for renovation planning | ✓ | ✗ | Avoids costly rework during construction |
| Capability | DeepSky IQ | Typical | Value Impact |
|---|---|---|---|
| Orthomosaic (2cm GSD, RTK corrected) | ✓ | ✓ | Site-wide visual baseline in one flight |
| Digital Surface Model (DSM) | ✓ | ✓ | Elevation data for flood/drainage modelling |
| Digital Terrain Model (DTM, ground classified) | ✓ | ✗ | True ground surface under vegetation |
| Volumetric cut/fill calculations | ✓ | ✗ | Accurate earthworks quantities for costing |
| Contour mapping (0.25m intervals) | ✓ | ✗ | Design-ready topographic data |
| GIS-ready export (GeoTIFF, LAS, SHP) | ✓ | ✓ | Direct import to council GIS systems |
| Multi-temporal change detection | ✓ | ✗ | Erosion/encroachment tracked over time |
| Survey-grade accuracy (2cm H, 5cm V with GCPs) | ✓ | ✗ | Replaces traditional ground survey |
| Capability | DeepSky IQ | Typical | Value Impact |
|---|---|---|---|
| HD video inspection (all submerged surfaces) | ✓ | ✓ | Visual record without draining asset |
| Sonar mapping and profiling | ✓ | ✗ | Full geometry in zero-visibility water |
| UT thickness measurement (in-situ) | ✓ | ✗ | Remaining wall life quantified |
| Zero confined space entry (no diver required) | ✓ | ✗ | Zero WHS risk, no diver permits needed |
| Cathodic protection assessment | ✓ | ✗ | Corrosion protection status verified |
| Sediment depth measurement | ✓ | ✗ | Dredging volumes calculated accurately |
| Capability | DeepSky IQ | Typical | Value Impact |
|---|---|---|---|
| Cloud-hosted data platform (ongoing access) | ✓ | ✗ | Data accessible 24/7, no USB handover |
| Interactive map-based viewer (no software install) | ✓ | ✗ | Any staff member can use immediately |
| On-platform measurement tools | ✓ | ✗ | Measure from desk, no return site visit |
| Multi-user access and role permissions | ✓ | ✗ | Whole team collaborates on same data |
| Design drawing overlay (DWG/PDF import) | ✓ | ✗ | Compare design intent to reality |
| Annotation and defect tagging | ✓ | ✗ | Defect register built during review |
| Automated PDF/Excel reporting | ✓ | ✓ | Report generation in minutes, not days |
| API integration (GIS, asset management systems) | ✓ | ✗ | Feeds directly into existing workflows |
| Capability | DeepSky IQ | Typical | Value Impact |
|---|---|---|---|
| RTK GNSS positioning (2cm horizontal) | ✓ | ✗ | Every point georeferenced to survey grade |
| Ground Control Points (GCP) validation | ✓ | ✗ | Independent accuracy verification |
| INS-corrected trajectory (100m GNSS dropout) | ✓ | ✗ | Accurate under trees and overpasses |
| MGA2020 / GDA2020 coordinate compliance | ✓ | ✓ | Australian standard datum compliance |
| Accuracy report with RMSE validation | ✓ | ✗ | Documented proof of data quality |
| Registered surveyor sign-off available | ✓ | ✗ | Legal weight for boundary/compliance work |
Road Network Digital Twin
Your entire road network delivered as a measurable, interactive digital twin accessible from any browser.

Every kilometre of captured data is unified into a single, searchable spatial platform. Engineers access 360-degree street-level imagery, survey-grade LiDAR point clouds, cross-section profiles, and Pavement Condition Index scoring without software installation or specialist training.

Measure rut depths, vegetation clearances, culvert dimensions, and bridge geometry from your desk. Overlay design drawings against as-built reality. Share view-only links with councillors, contractors, or funding bodies. Export condition registers directly to your asset management system.

Each subsequent survey builds on the last. Your digital twin becomes a living condition record that tracks degradation over time, informs predictive maintenance scheduling, and provides the evidence base for grant applications and capital works prioritisation.

One platform. Every asset. Measurable. Shareable. Permanent.50km included at no additional cost for networks over 250km
Want the full savings breakdown sent to your inbox? Please complete this form.
1. Scope your network >
2. We capture at up to 40km/h (no closures) >
3. Data processed in 5 business days >
4. Access via interactive platform.
Frequently Asked Questions
Does your road network assessment comply with IPWEA standards?
Yes. Our data outputs align with IPWEA Practice Note 9 and 12.1 guidelines. We provide condition grading on the standard 1-5 scale, ensuring the data can be directly ingested into your 10-year asset management plan and long-term financial reporting. Outputs are formatted for direct import into your existing asset management software.
How is your service different from other vehicle-mounted camera providers?
Most providers capture 2D images that only allow visual defect identification. We deploy vehicle-mounted LiDAR capturing 640,000 points per second simultaneously with 360-degree imagery. You do not just get a photo of a pothole or culvert; you get a measurable digital twin that lets your engineers calculate exact volumes, depths, and clearances from their desks. One pass delivers both the visual record and the engineering-grade spatial data.
Can you capture both unsealed rural roads and sealed highways?
Yes. Our mobile mapping systems are mounted on ruggedised 4WD vehicles with trained operators. This allows capture of your entire road network including remote unsealed roads, forestry tracks, fire trails, and regional corridors. No assets are left off your register regardless of terrain or access difficulty.
Do you require road closures or traffic management?
No. Our vehicle-mounted systems capture data while driving at normal traffic speeds (up to 40 km/h). This eliminates the need for traffic control, road closures, or personnel working on foot near live traffic. Both the cost and the WHS risk of the assessment are significantly reduced compared to traditional methods.
What data formats are delivered, and do they integrate with council systems?
Data is delivered in industry-standard formats including LAS/LAZ (point clouds), GeoTIFF (orthomosaic), GIS-ready shapefiles, geodatabases, and CSV condition registers. These integrate directly with major council platforms including Assetic, Conquest, Reflect, and ESRI ArcGIS. All data is also accessible via our interactive cloud platform where engineers can view 360-degree imagery, measure distances, and export condition reports without specialist software.
What happens if a bridge or culvert cannot be seen from the road?
For assets that cannot be captured from the road vehicle, our enterprise drone fleet captures bridge undersides, embankments, and elevated structures. For submerged assets such as culvert inverts, dam walls, and stormwater infrastructure, our underwater ROVs provide full visual and sonar inspection without draining or dewatering. All data is unified into a single digital twin of the complete infrastructure corridor.
How much does road condition assessment cost per kilometre in Australia?
Road condition assessment using mobile LiDAR and 360-degree imaging typically costs 40-70% less than traditional manual survey methods. Capturing at traffic speed eliminates the need for traffic management plans that can add $2,000-$5,000 per day to traditional approaches. For networks over 250 km, economies of scale reduce the per-kilometre cost significantly. The total program cost includes capture, processing, condition grading to IPWEA Practice Note 9, and delivery via interactive platform.
What is IPWEA Practice Note 9 and why does it matter?
IPWEA Practice Note 9 is the Australian standard framework for road condition assessment and asset management planning. It defines the 1-5 condition grading scale used by local councils to classify road segments, inform 10-year capital works programs, and support grant applications to state and federal governments. Compliance with PN9 is typically a requirement for Roads to Recovery funding, Financial Assistance Grants, and Fixing Local Roads program submissions.
Can mobile mapping capture footpaths, kerbs, and roadside assets?
Yes. The vehicle-mounted LiDAR system captures everything within a 100-metre corridor simultaneously, including footpaths, kerbs, signage, guard rails, drainage pits, vegetation encroachment, and overhead clearances. A single pass at 40 km/h delivers a complete asset inventory of the entire road corridor. Engineers can then extract cross-sections, measure clearances, and identify encroachment issues from their desks without return site visits.
How often should local councils assess road conditions?
IPWEA recommends condition assessments every 2-4 years for sealed roads and annually for high-traffic corridors. Many councils only achieve 5-10% sample-based coverage due to the cost and disruption of traditional methods. Mobile mapping enables 100% network coverage in a fraction of the time and cost, allowing councils to move from sample-based estimates to complete network intelligence.