

Energy & Utilities Asset Intelligence
Inspect your entire portfolio without planned outages, scaffolding, ropes or confined space entry. Your asset portfolio insights without the long operational shutdowns. Faster, Safer & More Complete Data.
ISO 14001
-
ISO 45001
-
ISO 9001
-
CASA Certified ReOC
-
$20m Insurance
-
ISO 14001 - ISO 45001 - ISO 9001 - CASA Certified ReOC - $20m Insurance -
PLANNED OUTAGE WINDOWS ARE LIMITED. CAPTURE CONDITION DATA WITHOUT ADDING TO YOUR SHUTDOWN SCHEDULE.
The Cost of Incomplete Asset Visibility
Outage Costs of $50,000 to $500,000
Planned outage windows cost $50,000 to $500,000 per event in lost generation or supply penalties Remote and Hazardous Environments
You manage assets in hard-to-reach, risky, or costly locations. Safety and liability concerns, the impact of expensive downtime, and lost opportunities.Complete Asset Intelligence Without The Operational Disruption
Energised Inspection
Inspect substations, switchyards, and transmission lines while they remain live. Our pilots hold authorised person training and operate from safe standoff distances with high-resolution zoom and radiometric thermal sensors. Energy and utility operators face compounding problems: ageing infrastructure, growing compliance obligations, an aging workforce and skills shortages. Traditional inspection methods require de-energisation, traffic management, and confined space entry, creating a backlog that grows faster than budgets allow.30% of outages are avoidable
Vegetation encroachment causes 30% of unplanned outages on distribution networks [Source: Energy Networks Australia]Regulatory Pressure & Documented Evidence Backlogs
Regulatory compliance cycles (5-year structural, annual visual) are creating backlogs across large portfolios. Verifiable, documented proof of asset condition, environmental impact, encroaching vegetation plans, OHS, and more. Manual reports and random photos leave gaps in compliance records and in the information needed to fix issues early.Multi-Environment Coverage
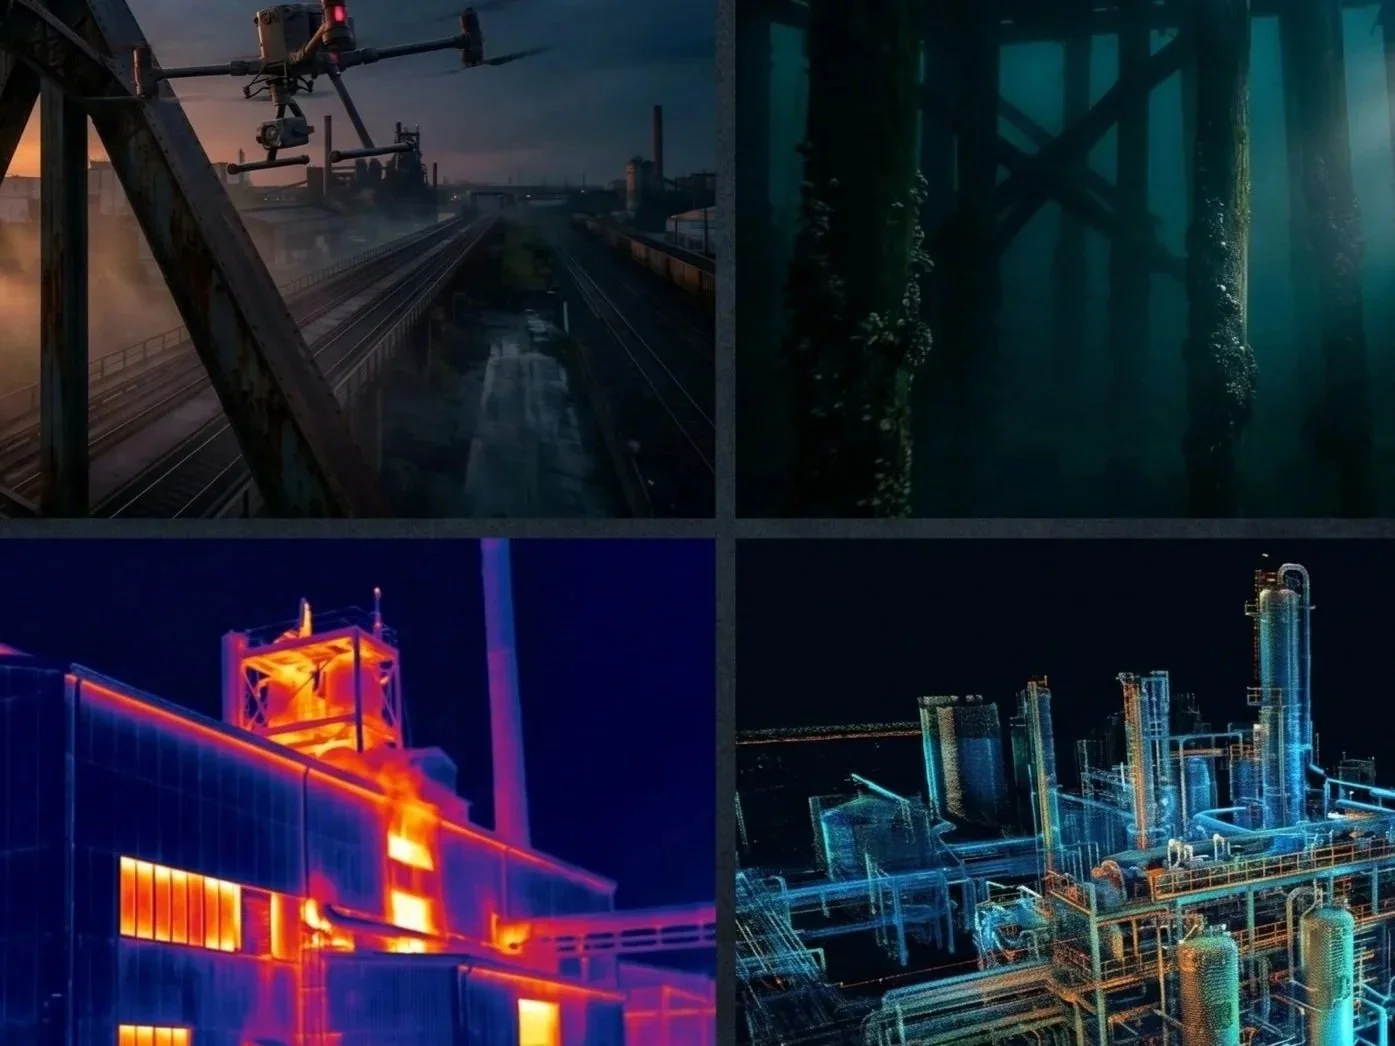
One partner for aerial (power lines, solar, wind), ground (substations, pipelines), confined space (turbine internals, tanks), and underwater (dams, intake structures, cooling systems).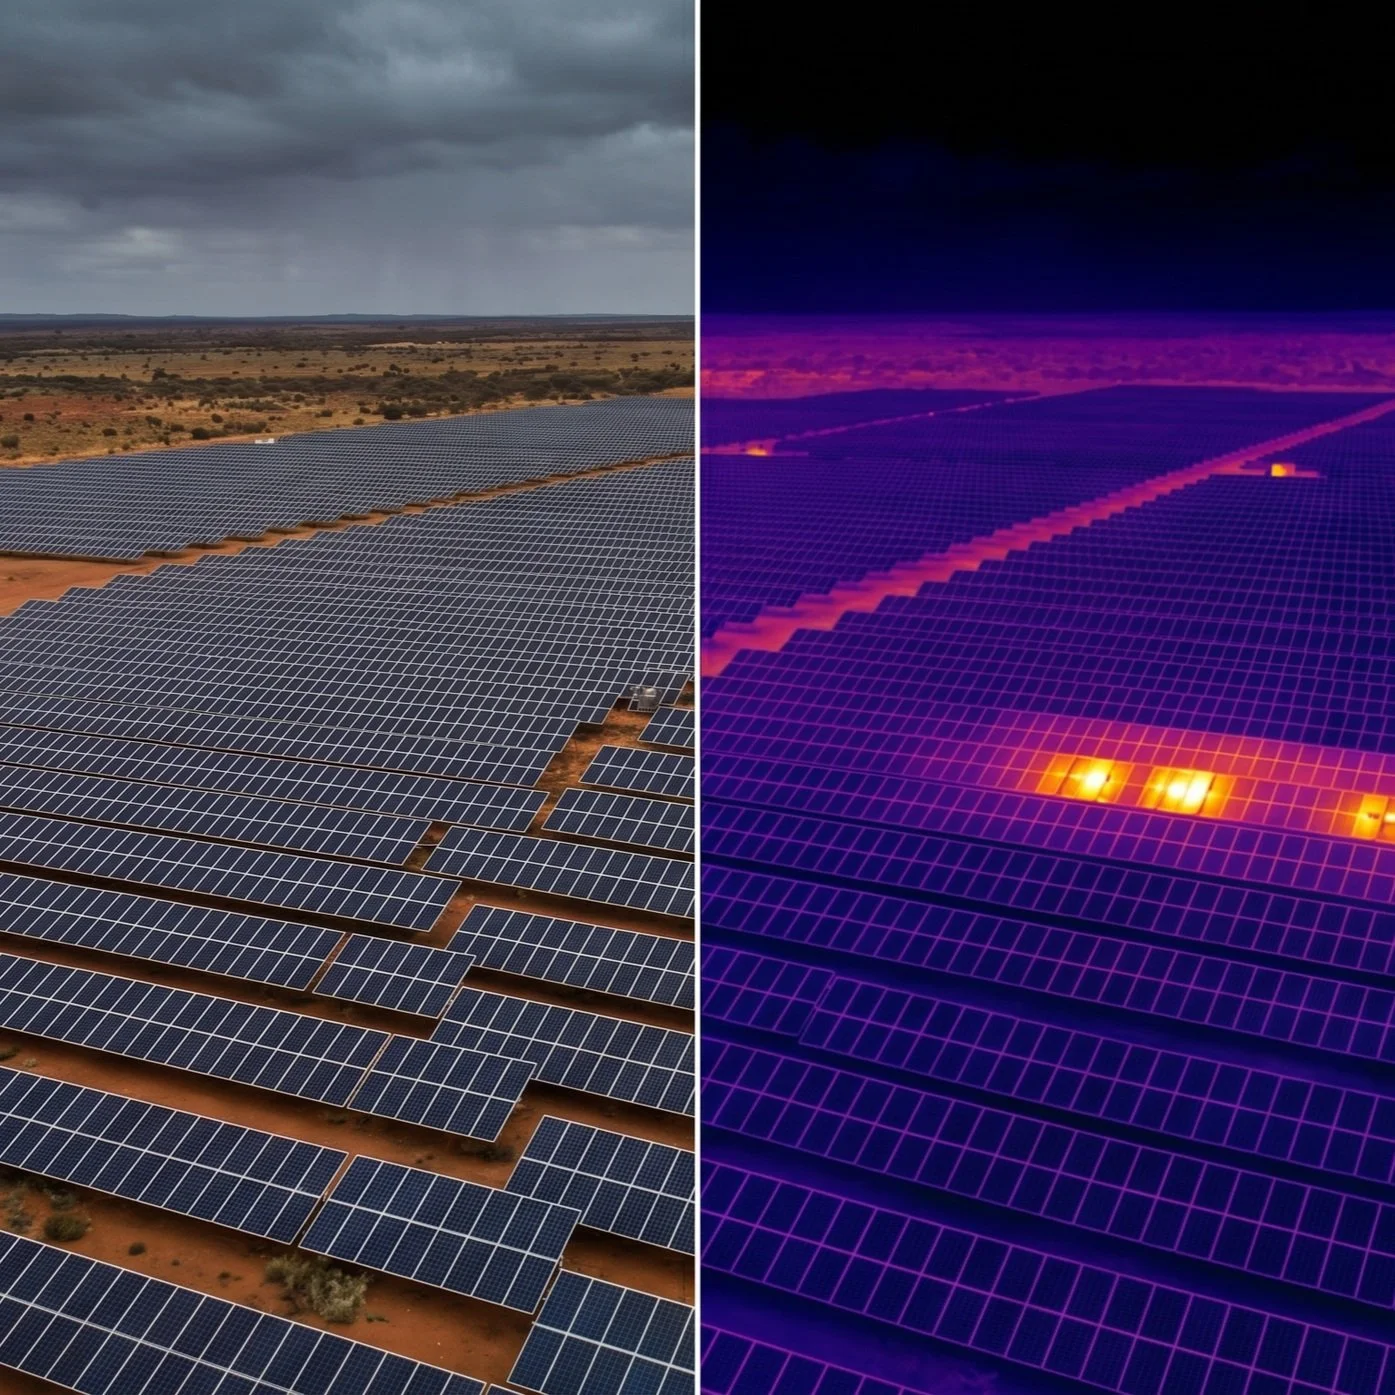
We reduce downtime, lower labour costs, enhance preventative maintenance, improve decision-making and strengthen sustainability outcomes across operations.Massive Asset Portfolios & 85% of the details are missed
Visual-only inspection misses up to 85% of subsurface thermal defects on electrical assets.Whether it's large power lines, solar farms, roads, bridges, dams, ports, railways, or mines. Using traditional methods to inspect them is slow, costly, and misses too much detail. DeepSky IQ delivers independent, engineering-grade inspection data across your entire energy and utility portfolio. We operate around live infrastructure with advanced CASA approvals, eliminating the need for de-energisation, scaffolding, ropes or confined-space entry.Defensible Condition Data
RTK-enabled capture at +/-2cm accuracy with Ground Control Points for absolute accuracy. Outputs include georeferenced thermal anomaly reports, defect severity classification (NETA MTS-2019), and time-series change detection for lifecycle planning.Thermal Fault Detection:
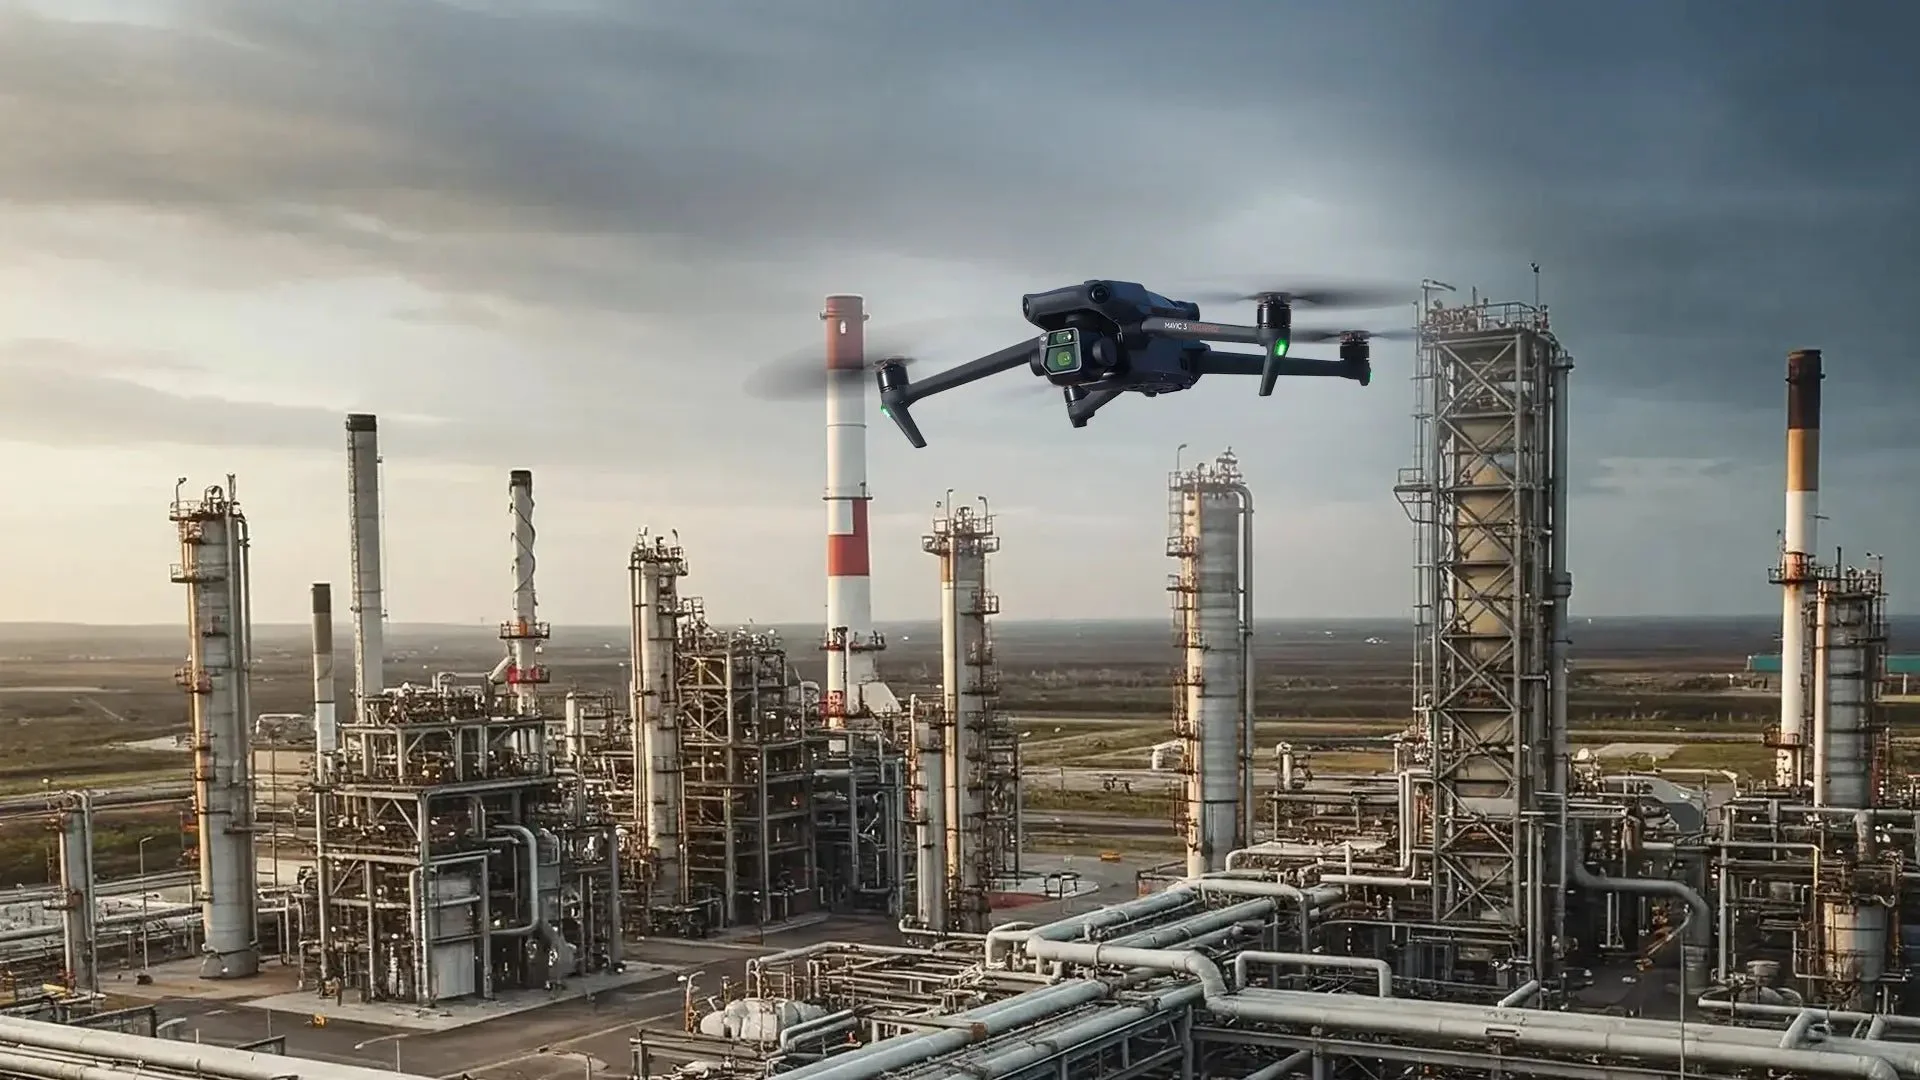
We identify electrical faults in power lines and solar farms before they cause catastrophic failure, using radiometric thermal imaging.Zero-Shutdown Inspections:
We inspect critical infrastructure, such as cooling ponds, storage tanks, and processing plants, to ensure they remain fully operational under most circumstances.Comprehensive Digital Twins:
We build accurate 3D-to-8D models of your sites, allowing your engineering teams to plan maintenance and upgrades remotely, with a single model from the tops of towers to 500m underwater, 360 degrees.Vegetation Management:
We use high-resolution and multispectral imaging to monitor vegetation and soil health, weeds, plants, and pest encroachment near power lines and other assets, and to identify high-risk areas before they cause outages. We also offer integrated pest management plans for long-term effectiveness, RPAS aerial spraying, spot-treating, hydroseeding, and fertilising.30-50% faster inspection cycles. Up to 60% reduction in working-at-height exposure.
Massive Asset Portfolios
An ageing workforce and skills shortage are limiting inspection capacityAssets Across Energy & Utilities

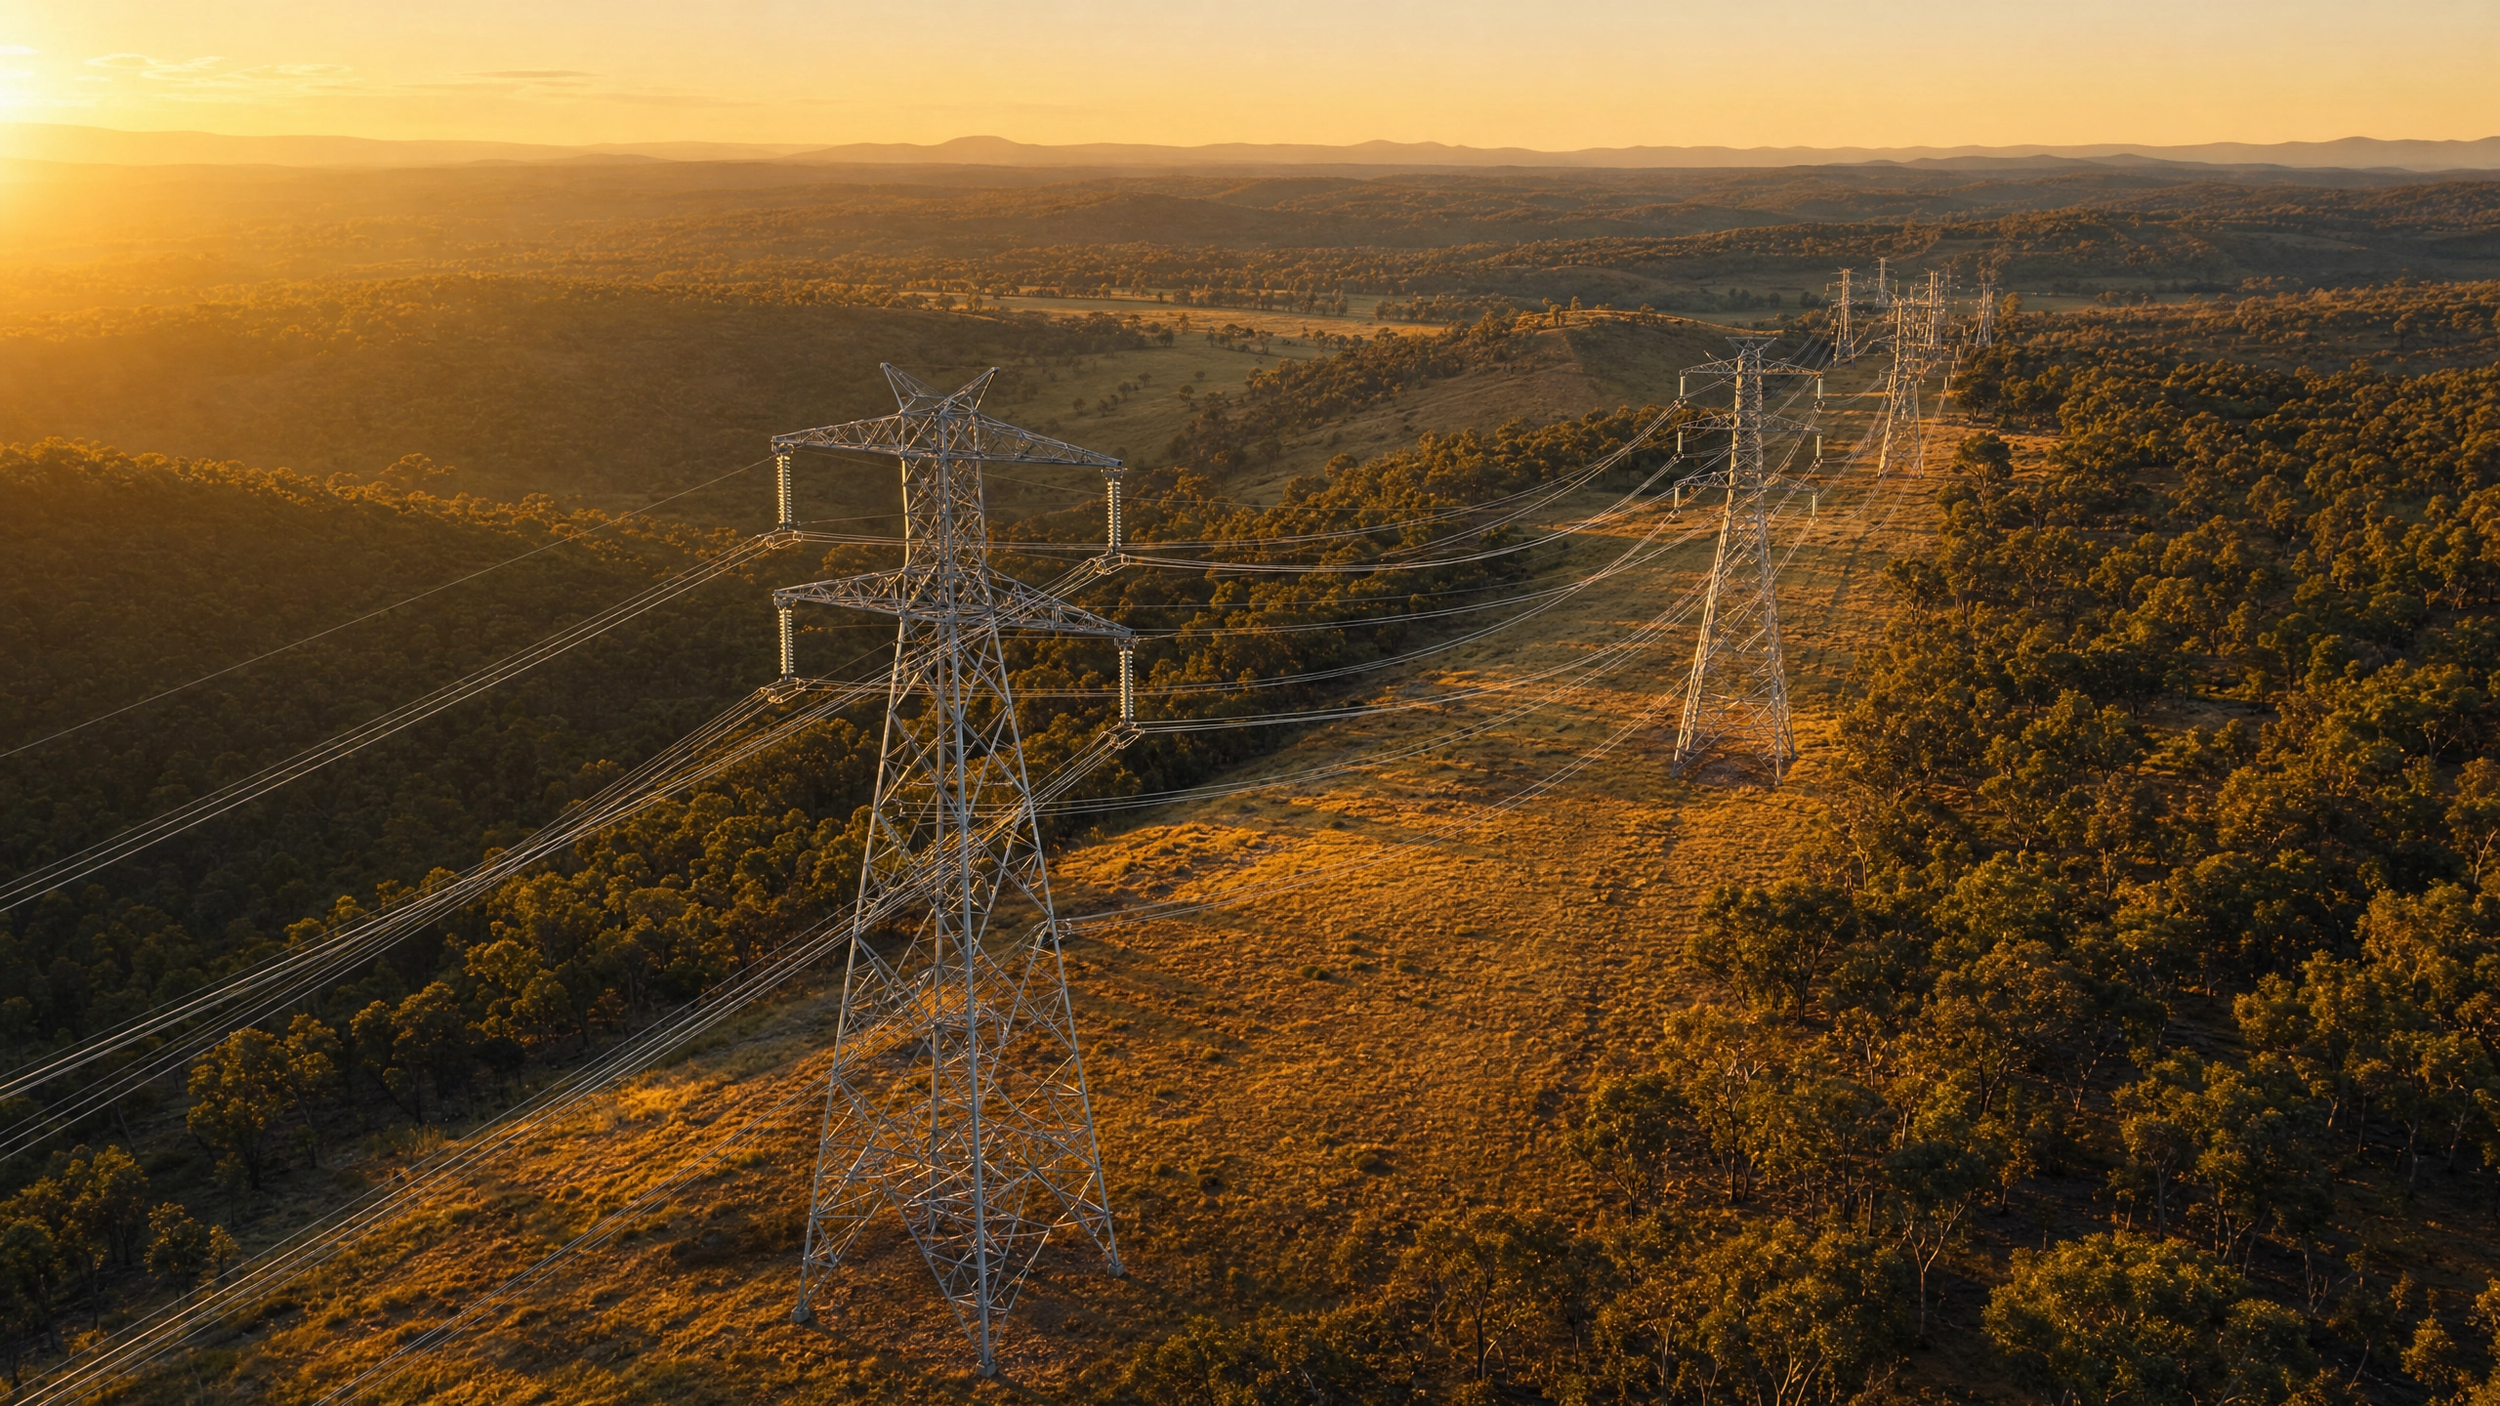
Transmission & Distribution Lines
Method: Aerial thermal + visual, LiDAR corridor mappingKey Deliverables: Defect register, vegetation clearance report, conductor sag analysis.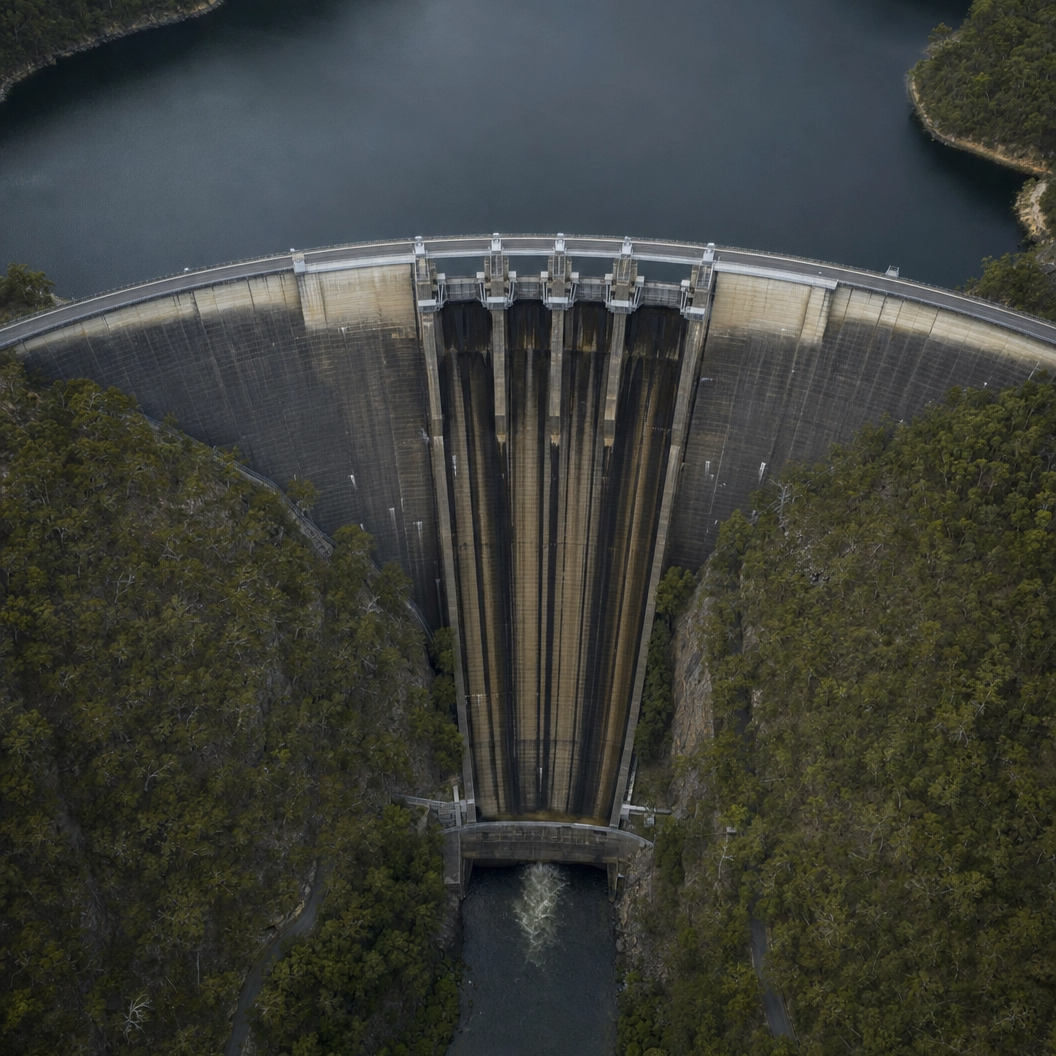
Dams, Reservoirs & Hydro Assets
Method: Aerial thermal + visual, LiDAR corridor mapping

Key Deliverables: Wall movement detection, spillway condition, crack mapping, erosion, and submerged intake inspection plus more.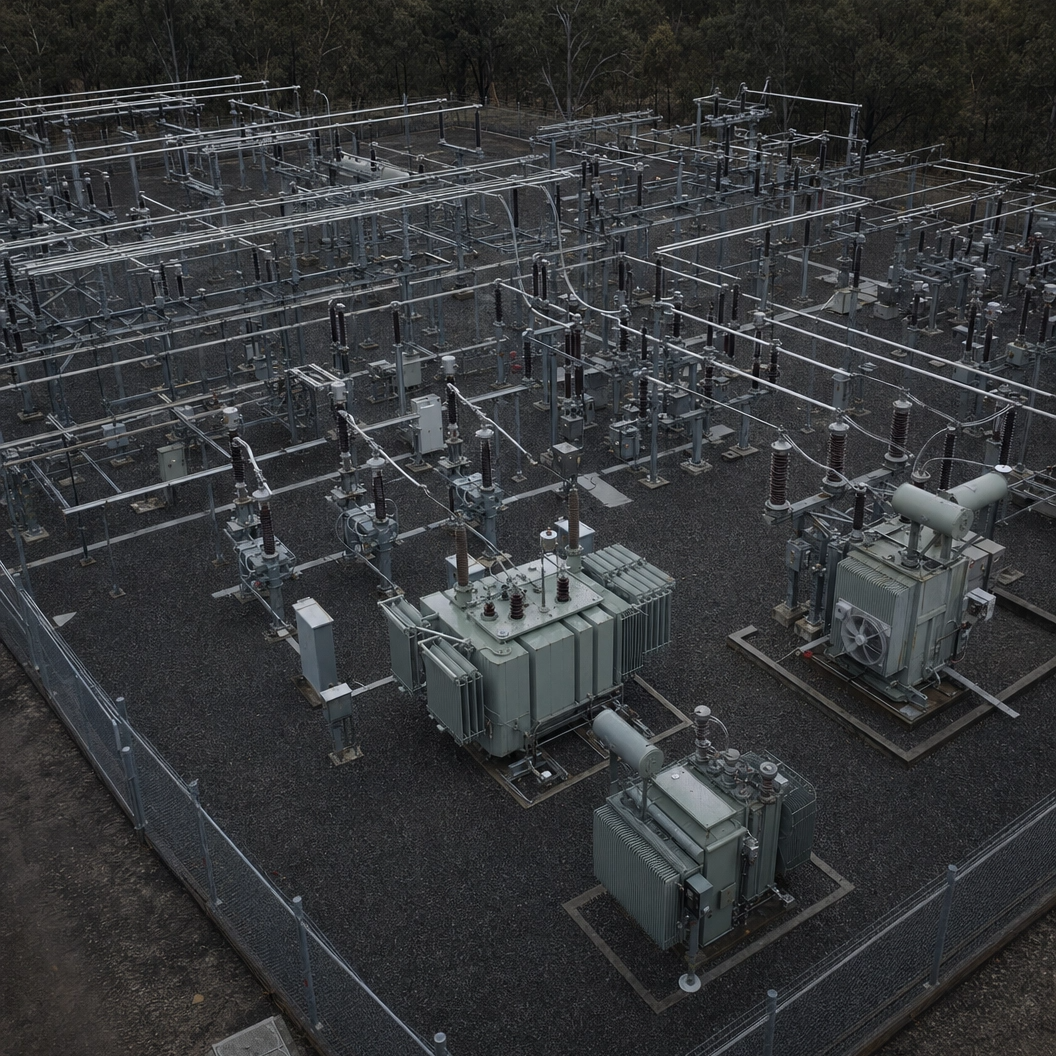
Substations & Switchyards
Method: Aerial thermal + zoom (energised)

Key Deliverables: Hot joint identification, insulator condition, NETA severity classification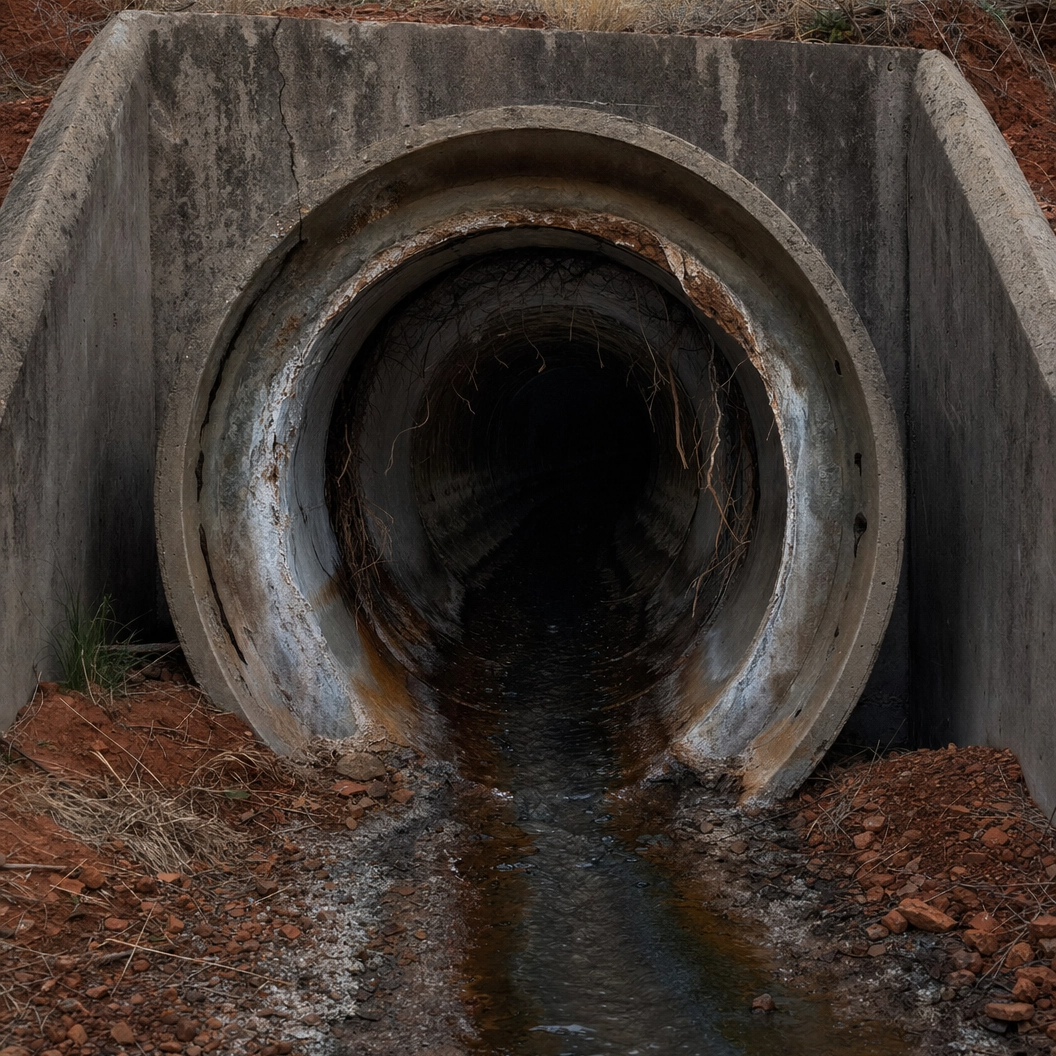
Water & Sewer Networks
Method: Confined space drone + ROV

Key Deliverables: Pipelines & Culverts, Internal pipe condition, blockage detection, corrosion mapping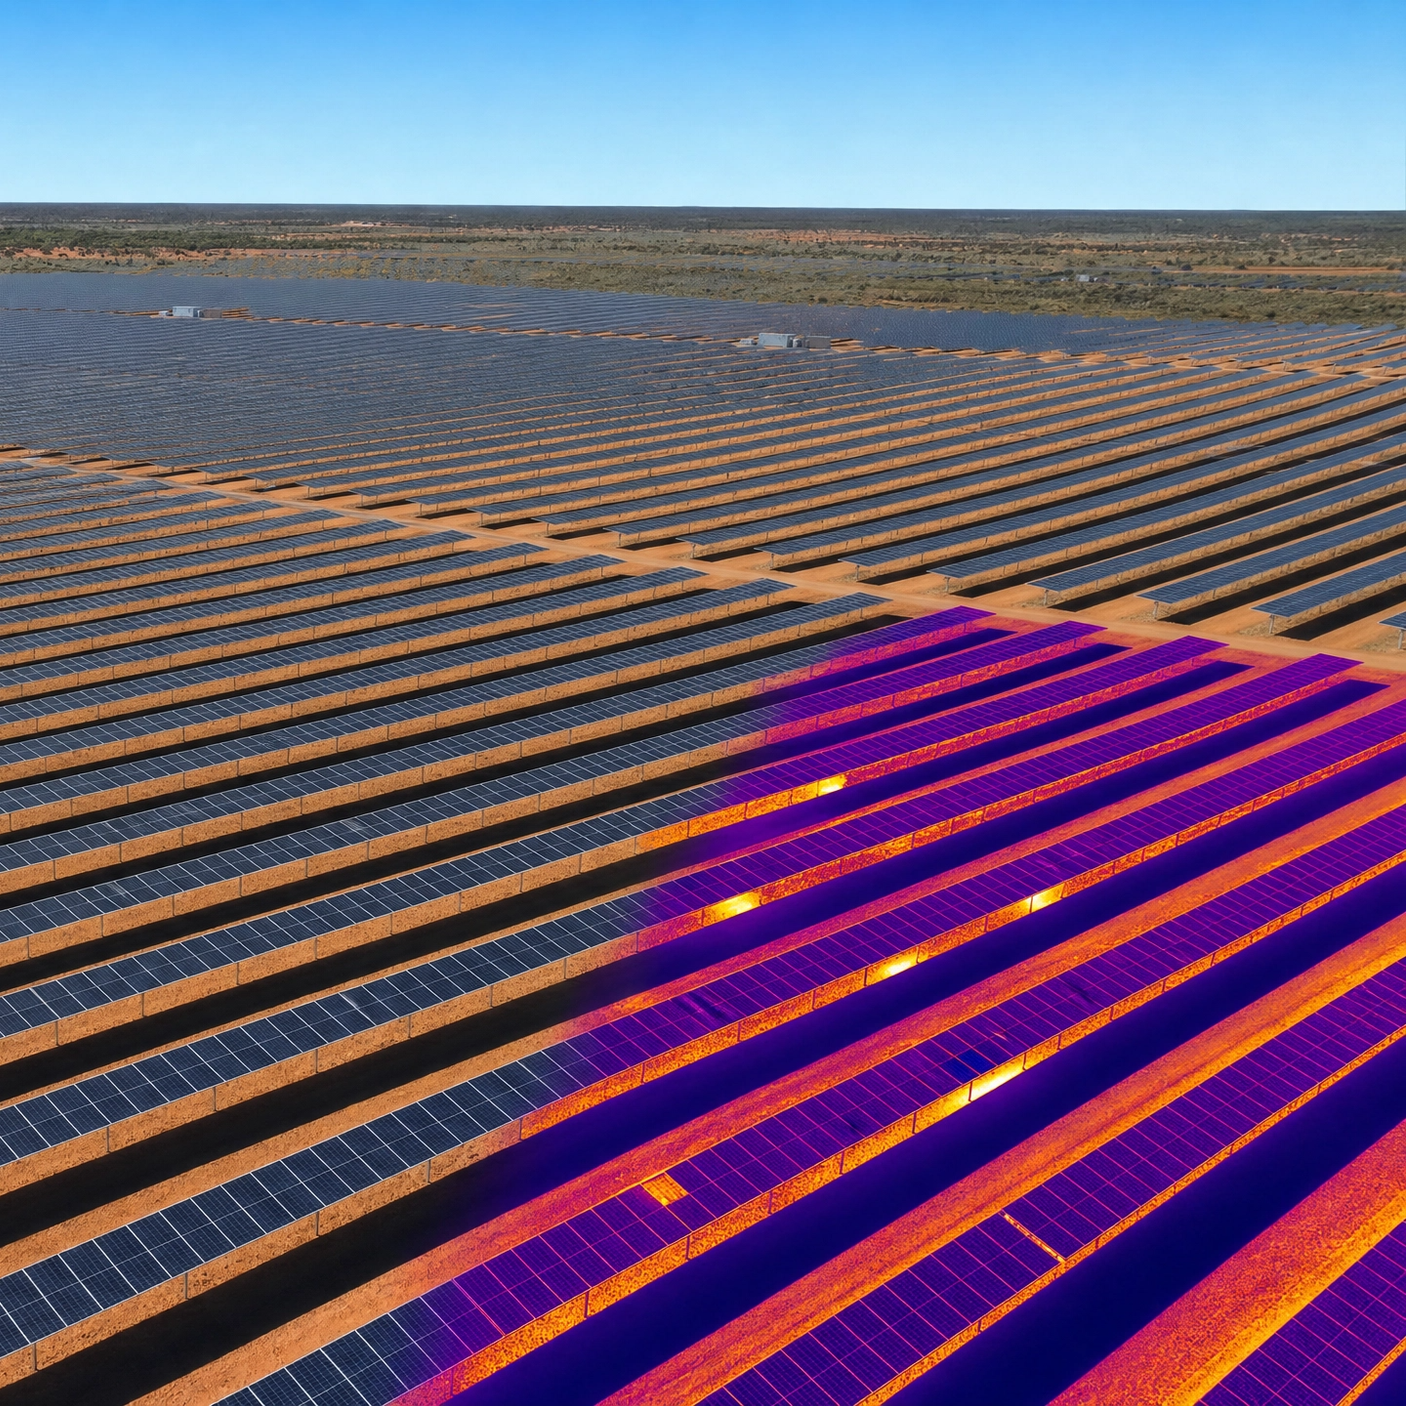
Solar Farms
Method: Aerial thermal + visualKey Deliverables: Cell/string fault detection, soiling analysis, IV curve correlation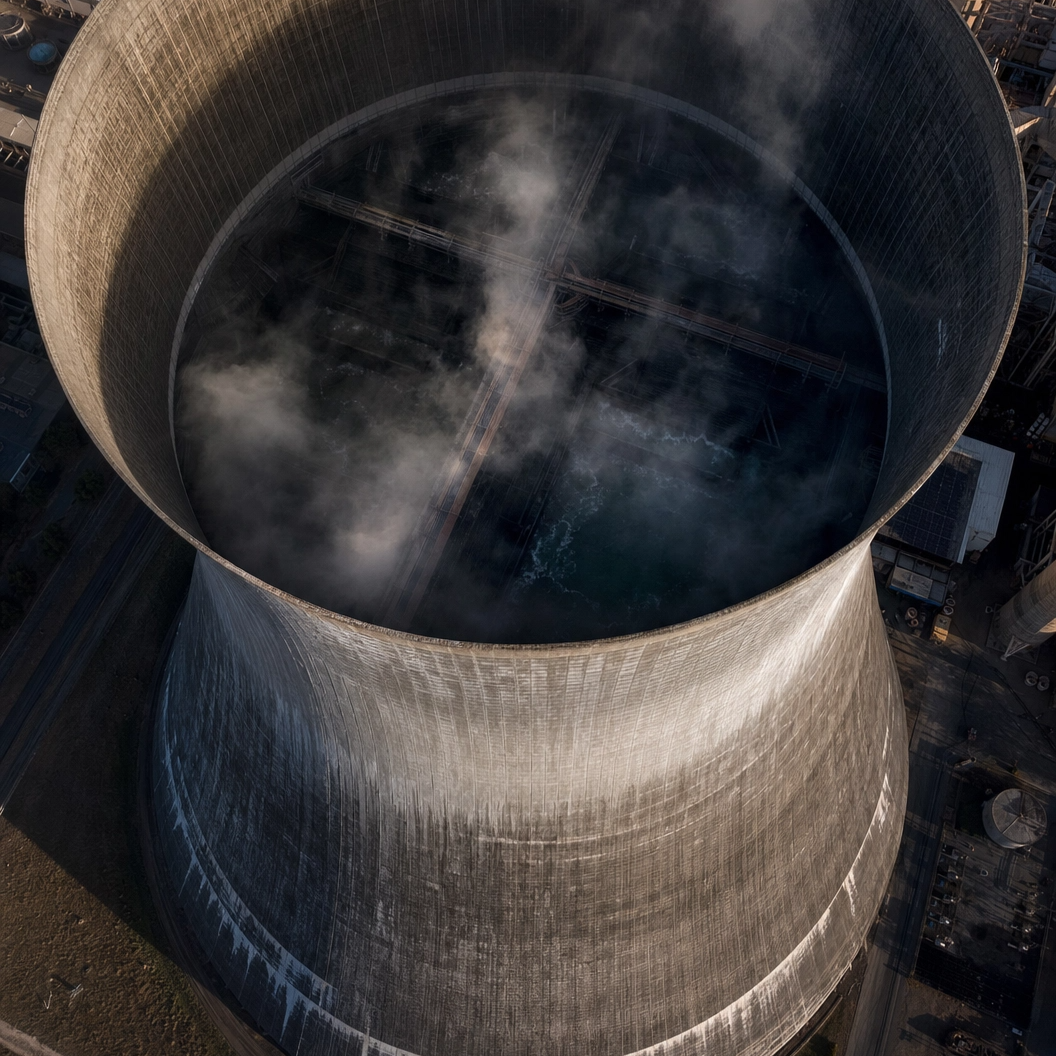
Tanks & Storage Vessels
Method: Confined space drone visual& LiDAR (internal) + aerial visual/thermal/LiDAR (external) + contact-based ultrasonic thickness measurement.Key deliverables: Internal lining condition, floor plate corrosion mapping, shell plate thickness (API 653), roof condition, nozzle and fitting, thermal performance, structural NDT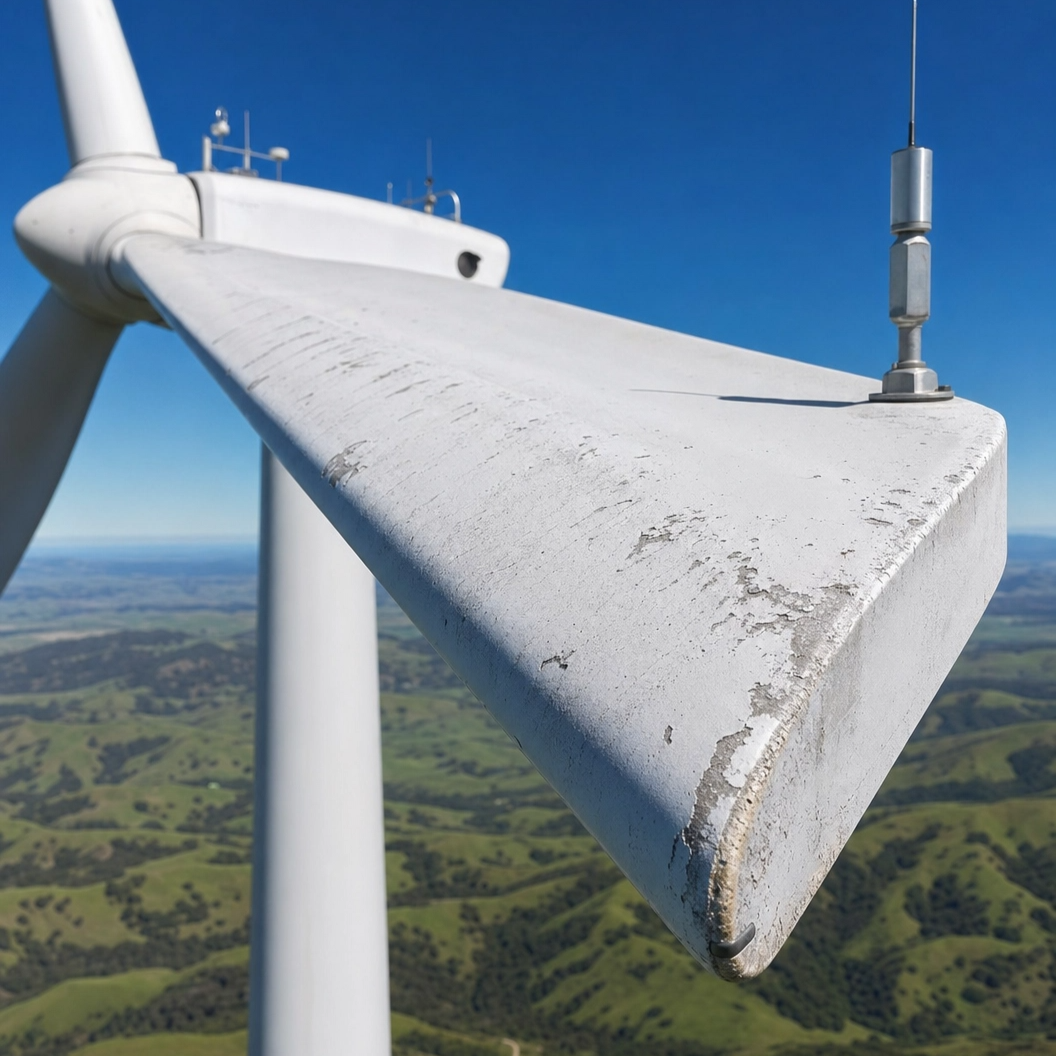
Wind Turbines
Method: Aerial visual + thermal (blade, nacelle, tower)Key Deliverables: Leading edge erosion mapping, lightning damage, and crack propagation tracking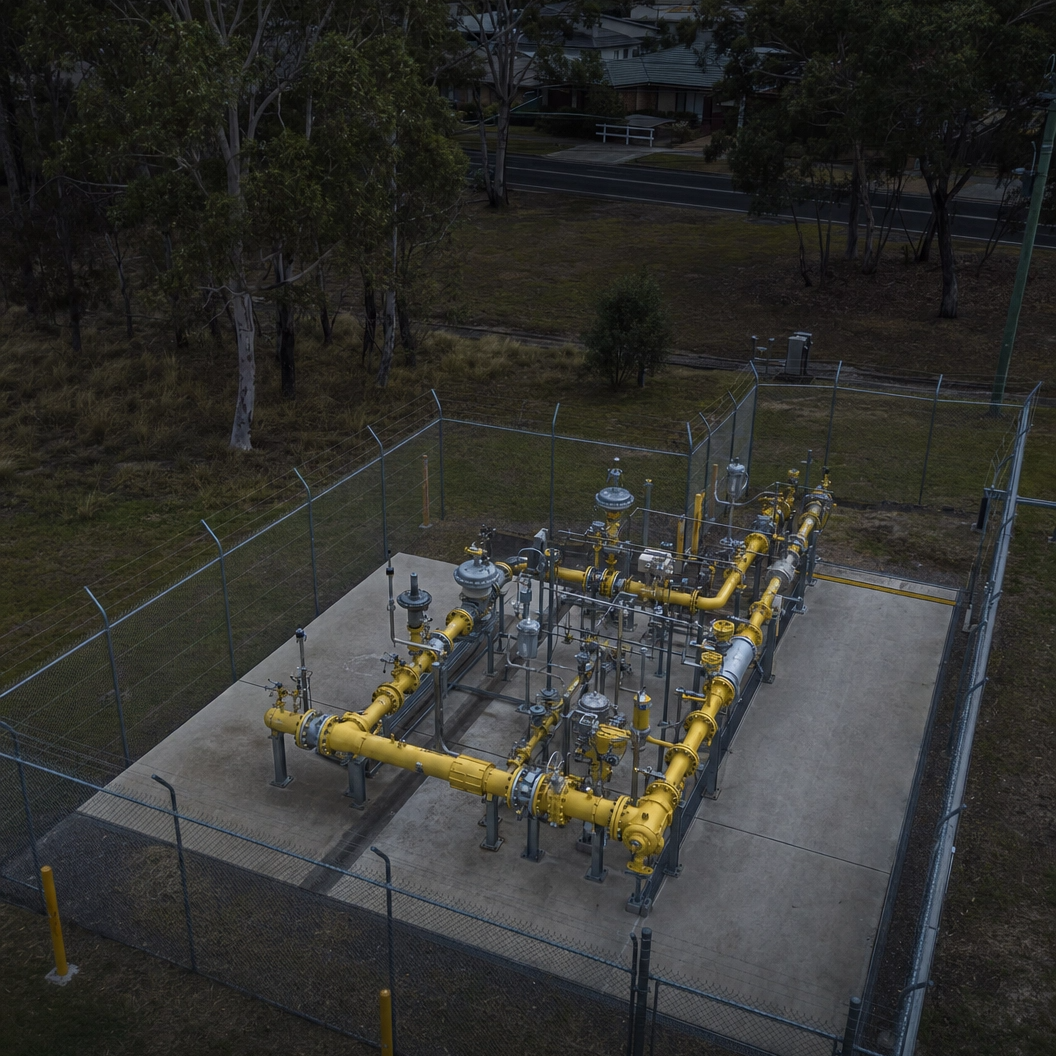
Gas Distribution
Method: Aerial & Ground-level thermal + Gas Detection Sensors

Key Deliverables: Leak detection, easement compliance, cathodic protection assessment, vegetation, ground movement, erosion in the corridor and environment around the pipe.
60 - 80 %
Cost Reduction vs Helicopter Based Inspections$50k - $500k
Avoided Per Outage0.1 mm
Crack Detection Resolution +/ - 2cm
RTK Positional Accuracy for Spatial Deliverables30-50% faster inspection cycles | Up to 60% reduction in working-at-height risk exposure | 80% less Shutdowns
How It Works (Process)
Step 1: Scope & Risk Assessment
We assess your asset portfolio, identify priority inspection targets, and develop a program that aligns with your maintenance windows, categorisations and compliance cycles. No generic proposals.Step 2: Mobilisation & Capture
Our CASA-certified pilots deploy enterprise platforms (e.g. Multirotor, VTOL, 360 Cameras, Confined Space Drones, ROVs) with thermal, visual, LiDAR, and NDT sensors as required by the scoping. We operate around live infrastructure without requiring shutdowns in most circumstances unless a safety risk or quality risk is present.Step 3: Processing & Analysis
Raw data is processed into engineering-grade deliverables: georeferenced defect registers, thermal anomaly reports with NETA severity classification, 3D to 8D digital twins, and change detection overlays.Step 4: Reporting & Integration
Deliverables are formatted for direct integration into your asset management system (e.g. Maximo, SAP, GIS). Structured for audit readiness, compliance reporting, and lifecycle planning. Applicable Services
Scope Your Energy & Utilities Inspection Program
Whether you need a single substation thermal scan or a portfolio-wide powerline inspection program, we scope to your compliance cycle and maintenance windows.-
Asset & Condition Intelligence Inspections - Visual, thermal, and LiDAR inspections across all environments.
-
Thermal & Condition Assessment - Radiometric thermal imaging for electrical and mechanical anomalies
-
Confined Space & Interior Inspections - Turbine internals, culverts, tanks, and pipe networks without human entry
-
Underwater & Submerged Infrastructure - Dam intakes, cooling systems, culverts, wiers, and submerged infrastructure
-
Digital Twins & 3D to 8D Modelling - Measurable spatial models for remote assessment and planning.
-
Asset Monitoring Programs - Scheduled repeat inspections with change detection and trend analysis
-
Survey-Grade Spatial & Measurement Intelligence - Photogrammetry, RTK, GCPS, PPK, 360 Cameras, all to enable accurate LiDAR corridor mapping, vegetation clearance, and conductor sag based on your scope.
Frequently Asked Questions
Can you inspect live power lines and substations without shutdowns?
Yes. Our pilots hold authorised person training and operate enterprise drones with radiometric thermal cameras and high-resolution zoom lenses at safe standoff distances from live conductors (typically 5-15 metres). Substations, switchyards, and transmission lines are inspected while fully energised, eliminating the planned outage window that typically costs $50,000 to $500,000 per event in lost generation or supply penalties. Thermal imaging identifies hot joints, overloaded connections, failing surge arresters, and degraded insulators. Temperature differentials as low as 2-3 degrees Celsius above ambient indicate developing faults, while differentials over 10 degrees Celsius indicate critical defects requiring immediate intervention.
How much does drone powerline inspection cost compared to helicopter or ground-based methods?
Drone-based powerline inspection typically delivers 60-80% cost savings compared to helicopter methods and 70-90% savings compared to ground-based climbing crews. Helicopter inspection typically costs $1,500-$4,000 per kilometre, while ground-based crews cost $3,000-$8,000 per kilometre. For a 500km distribution network inspected annually, operators typically achieve savings of $325,000 to $1,600,000 per year when switching from helicopter to drone-based methods. Additional ROI comes from higher defect detection rates and precise vegetation encroachment mapping that reduces unplanned outage risk.
What is the ROI of switching from helicopter to drone powerline inspection?
Operators typically achieve 60-80% cost reduction per kilometre, faster inspection cycles (30-50% time savings), and higher defect detection rates due to closer proximity to conductors. The ROI compounds through reduced vegetation management costs (precise encroachment mapping versus broad-area clearing), elimination of large landing zone requirements in urban areas, and lower safety risk exposure for personnel. Vegetation encroachment causes approximately 30% of unplanned outages on distribution networks. Precise corridor mapping with LiDAR and multispectral imaging identifies high-risk encroachment zones before they cause outages.
Can drones inspect the inside of storage tanks and confined spaces without human entry?
Yes. We deploy enterprise confined space drones to inspect tank internals, turbine housings, pressure vessels, and other enclosed assets without human entry, purging, or scaffolding. The drone captures high-resolution visual imagery, thermal data, LiDAR point clouds, and ultrasonic thickness measurements of shell plates, floor condition, roof structure, and internal fittings. This eliminates the 4-8 hours typically required for isolation, purging, and atmospheric testing. Real-time gas monitoring (14+ combustible gases at 0.1% LEL) runs simultaneously, providing continuous atmospheric awareness.
What defects can thermal imaging detect on electrical infrastructure?
Radiometric thermal imaging detects hot joints (loose connections), overloaded conductors, failing surge arresters, degraded insulators, transformer cooling issues, unbalanced loads, and corrosion under insulation (CUI). On solar farms, thermal imaging identifies cell and string faults, bypass diode failures, soiling patterns, and potential ignition points before they cause fire or production loss. Visual-only inspection misses up to 85% of subsurface thermal defects on electrical assets. Our AI-powered analysis automatically classifies defects by severity (minor, serious, critical) according to NETA MTS-2019 standards.
How do drones inspect wind turbines without stopping them?
Tower and nacelle inspection can proceed during normal turbine operation. Blade inspection requires the turbine to be stopped and locked, typically for 2-4 hours per turbine. A single drone team can inspect 8-12 turbines per day compared to 1-2 per day using rope access, representing a 4-6x throughput improvement. Defects detected include leading edge erosion, lightning strike damage, crack propagation, blade root delamination, and surface coating degradation. Resolution is sufficient to identify cracks as small as 0.5mm.
Can drones and ROVs inspect dams and water infrastructure?
Yes. We deploy aerial drones for dam wall faces, spillways, and surrounding embankments, combined with underwater enterprise ROVs for submerged components including outlet valves, intake structures, and dam toe areas. This multi-environment approach provides comprehensive dam condition intelligence without draining the reservoir or deploying divers. LiDAR-equipped drones detect millimetre-level movement in dam walls and map cracks with change tracking over time. ROV-mounted sonar maps sediment accumulation and identifies scour patterns. All data is integrated into a single measurable digital twin.
What certifications do you hold for energy infrastructure inspection?
DeepSky IQ holds a CASA commercial operators licence with advanced endorsements including Extended Visual Line of Sight, Enclosed Beyond Visual Line of Sight, night operations, and operations over populated areas. Our pilots are trained as authorised persons for operations around high-voltage infrastructure. We also hold ISO 9001 (Quality), ISO 14001 (Environmental), and ISO 45001 (Work Health and Safety) certified management systems, and carry $20M public liability insurance. All operations are conducted under documented safety management systems with site-specific risk assessments.
How does drone inspection integrate with our existing asset management system?
Deliverables are structured for direct integration into your existing asset management platforms including Maximo, SAP, and GIS. Outputs include georeferenced defect registers with severity classification, thermal anomaly reports, condition scores, and 3D digital twins with position-tagged observations. AI-powered defect detection automatically classifies anomalies by type and severity. Reports are formatted for audit readiness and aligned to your existing compliance frameworks. Data exports in open formats (LAS, GeoTIFF, CSV, GeoJSON, IFC) for direct import into any enterprise system.
What is the difference between a one-off inspection and an ongoing monitoring program?
A one-off inspection captures a point-in-time condition snapshot. An ongoing monitoring program establishes a baseline digital twin and tracks change over time through scheduled repeat surveys. Monitoring programs deliver significantly higher value because they enable predictive maintenance, automated change detection, and trend analysis that supports capital planning and regulatory compliance. Each survey compounds the intelligence of the last. Programs are structured around your maintenance windows and compliance cycles with step-down pricing at volume.
Infrastructure & Transport - Bridge, Road, Rail, and Tunnel inspections
Oil & Gas - Pipeline, refinery, and offshore asset inspection
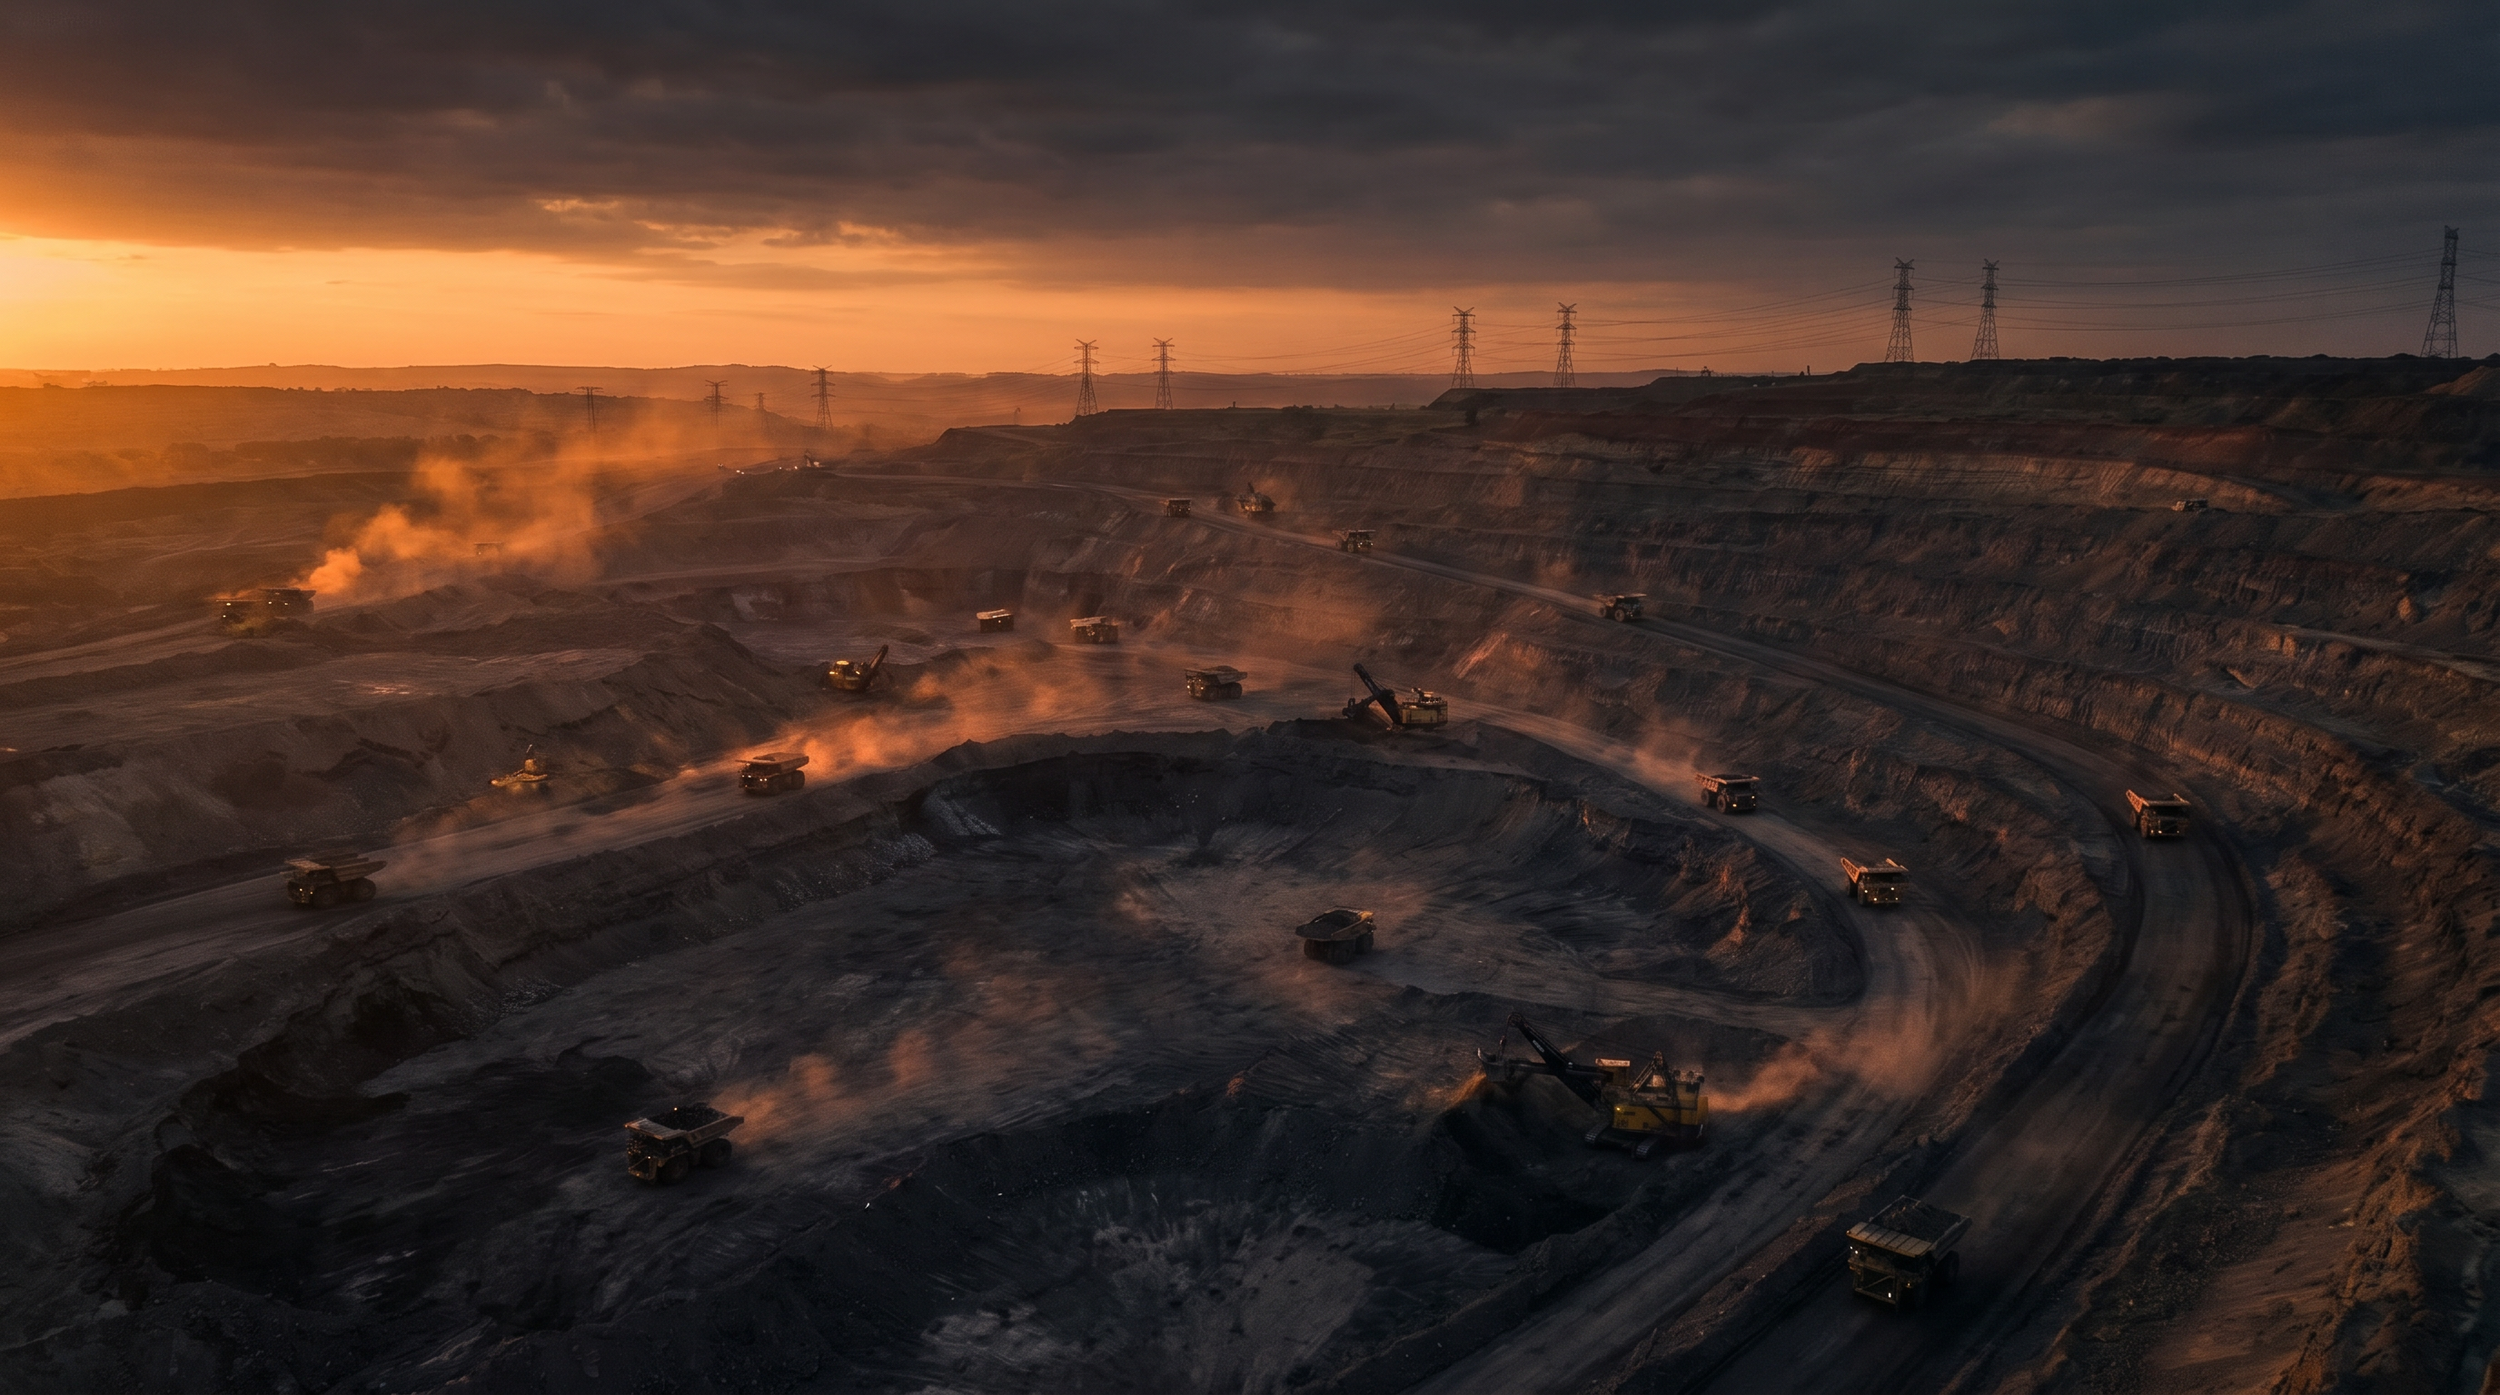
Mining & Resources - Conveyor, stockpile, assets, infrastructure, mapping and processing plant inspection
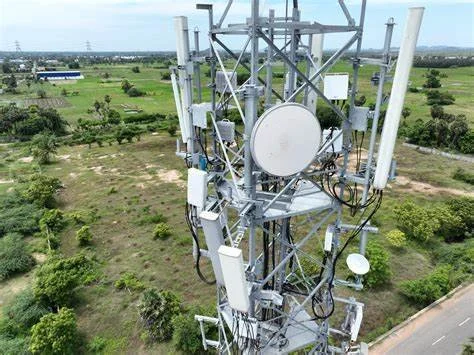
Telecommunications - Towers, antennas, and corridor inspection